INSUBCONTINENT EXCLUSIVE:
Rookout, a startup that offers debugging tools for applications that run on modern container and serverless platforms, is launching a new
feature today that brings the equivalent of breakpoints to Kubernetes.
&Traditional debuggers leave developers helpless on Kubernetes,
because they can&t debug multiple ephemeral, shifting, distributed concurrent instances of code,& the company argues in its announcement
&The powerful and familiar features that debuggers provide, like breakpoints, are missing.&
To get around this, developers tend to go for a
more indirect way of diagnosing issues and debugging their apps running on Kubernetes
That mostly means logging and distributed tracing, both of which have spawned their own ecosystems of open-source projects and startups
Rookout argues that these systems are hard to set up and can only give you a relatively high-level view of what happening inside a
container.
While the company talks about this feature as &breakpoints,& though, we&re not talking about the traditional breakpoints you
are probably familiar with from your IDE
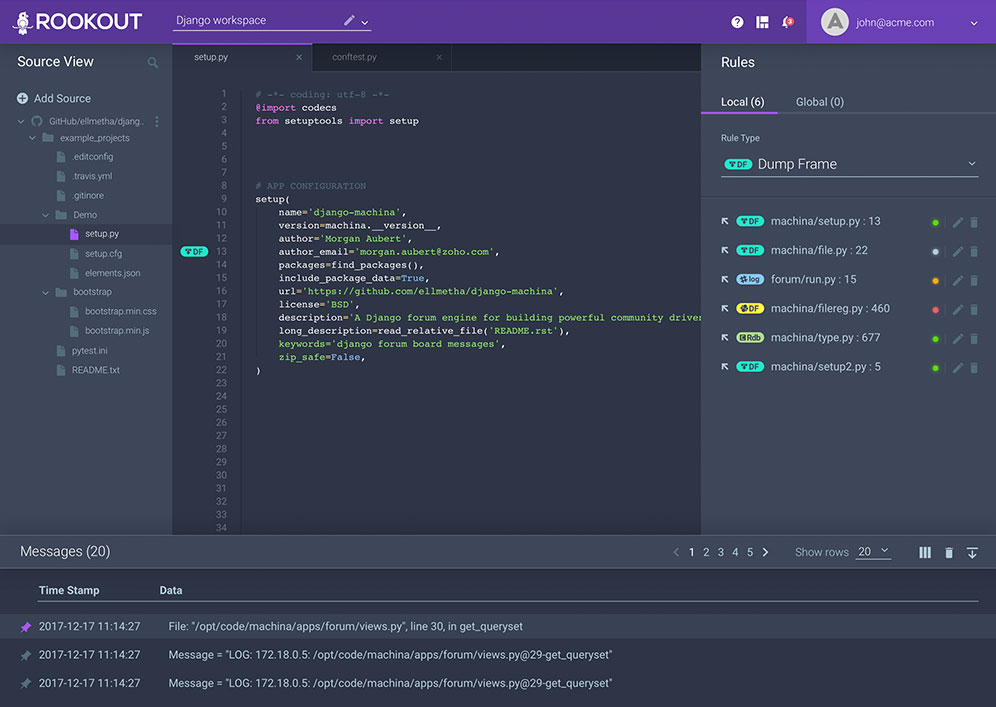
Instead, Rookout collects full-stack data but doesn&t actually stop the execution of the code
That may make it sound more like it closer to tracing and logging than the company makes it seem, but you can actually use the system to get
data about a single variable state and the promise is that you can do so with just a few clicks
And because there are no real breakpoints, you can use the system on both development and production systems.
&Nobody wants to install and
run complicated, high-overhead monitoring solutions just to be able to indirectly debug Kubernetes,&saysRookout CTO and co-founder Liran
Haimovitch in today announcement
&Rookout goes beyond the trace level, giving developers and DevOps back the breakpoints they need to understand their applications, without
having to stop the app to write new code.&
Rookout raises $4.2M for its rapid production debugging platform

